- Home

- Gawie Herbst

Connecting to a MS Access Database
Connecting to a Microsoft Access database requires an ODBC connection. As you probably know, ODBC connections are possible in Yellowfin but involves a bit more work to set-up.
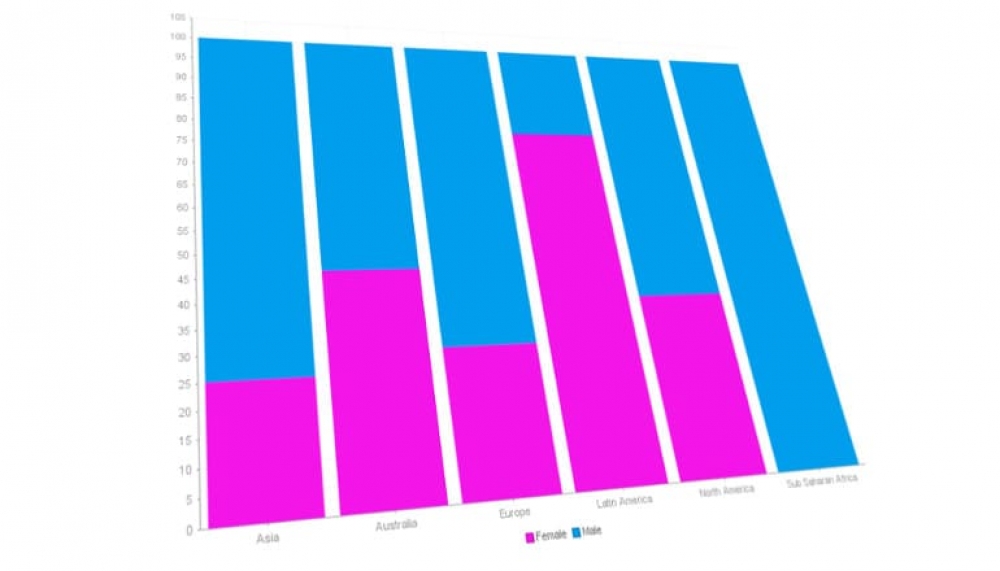
100% Stacked Column Charts
The 100% Stacked Column Chart is an extension of the Stacked Column chart in that it compares the percentage that each value contributes to a total.

Moving your Yellowfin application
There may be several reasons for moving your Yellowfin Application into a different location – you might be running out of space on the current disk drive or you just want to change the name of your Yellowfin folder.

Choosing the right chart type
Using charts or graphs are a great way to present data and often the preferred manner that our users view their data.

Creating a Year over Year (YOY) Comparison
This article describes how to build a report to compare year over year data.

Adding context to your charts
A few articles back, I wrote about Parameter Replacement in Yellowfin to provide better narratives to your reports and dashboards. Another feature that goes hand in hand with this is Set Analysis.

Speed up your website data analysis
Do you know how many visitors your website receives every day? Do you know which pages get viewed and which ones your clients spend the most time on? Insights like these will give you a good idea of what you might do better.

Custom Sorting
Many of the reports customers need involve data that are sorted by month. Let us take a ‘Sales by Month’ report.
Popular Posts
- Freehand SQL reports Written on Sunday, 18 November 2018 21:18

- Speed up your website data analysis Written on Monday, 09 July 2018 19:27
