In this article you will learn how to create tooltips on your dashboard. See the steps below:
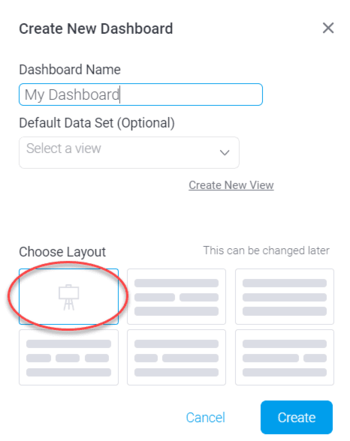
Create a new dashboard using the blank canvas.
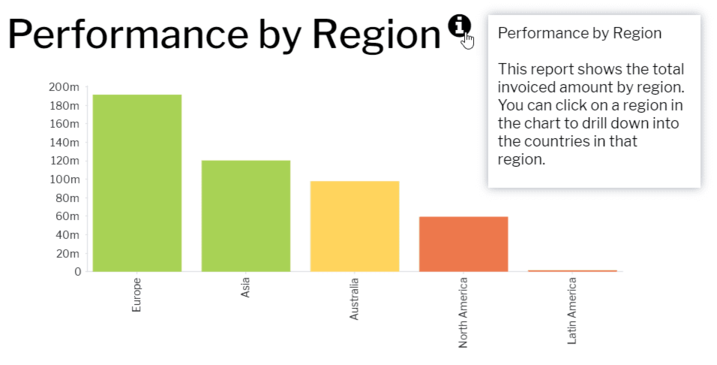
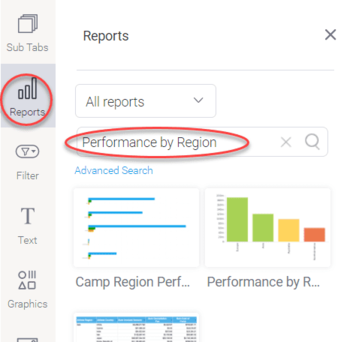
Use the Reports icon on the panel on the left, search for the “Performance by Region” report and drag this report onto the dashboard. This is only to demonstrate the Tooltip functionality, but you can implement this on your existing dashboards.
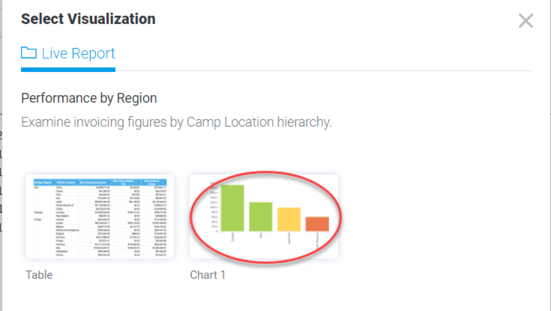
Click on “Chart 1” when asked to select the visualization. This will add the chart to the dashboard.
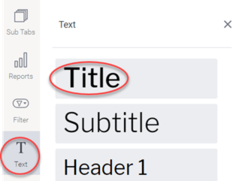
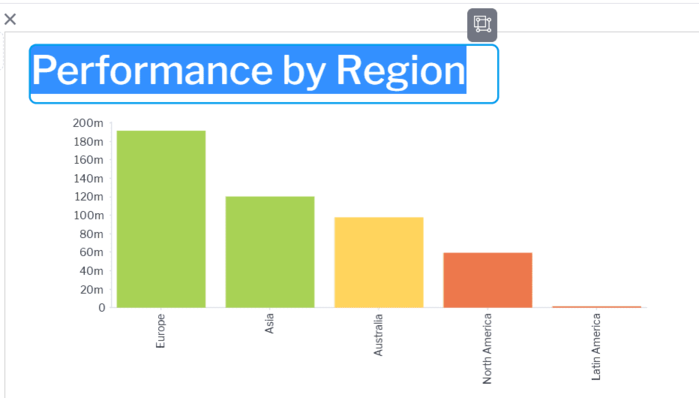
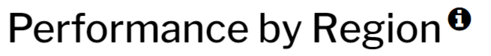
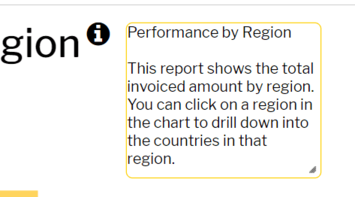
Add a Title to your dashboard and enter the “Performance by Region” text.
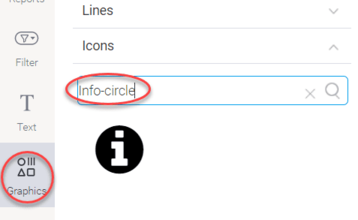
Next, we need an icon or image that we can attach the Tooltip to. For this, we are adding an icon to the dashboard. Using the graphics icon on the panel on the left, go to Icons tab and search for the “Info-circle” icon.
Drag this icon next to the Title created in step 4.
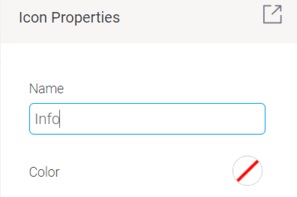
Select the icon on the dashboard and use the properties panel to change the name to “Info”. We need this to identify the object in the Code Mode editor
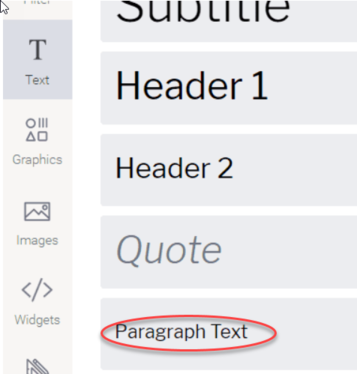
Add another text object to the dashboard canvas and enter your Tooltip text.
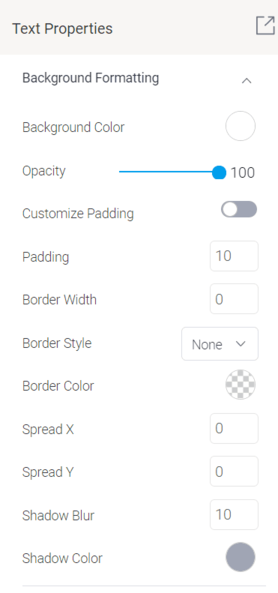
Use the properties panel on the right and set the following properties:
Name: Tooltip Background Color: White Padding: 10 Shadow Blurr: 10 Shadow Color: Grey
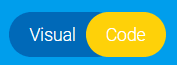
Click on the Code button at the top of the dashboard to access the Code Mode Editor. If you do not see this button, make sure that Dashboard Code mode is enabled in the configuration settings and that your user has the necessary Role permissions.
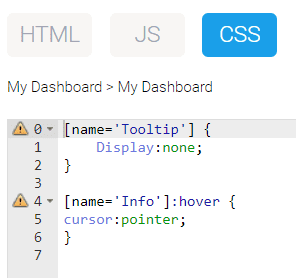
Select the CSS editor and add the following code to hide the Tooltip text object when a user opens the dashboard. We are also changing the mouse cursor to a pointer when the user hovers over the Info icon.
[name='Tooltip'] { Display:none; } [name='Info']:hover { cursor:pointer; }
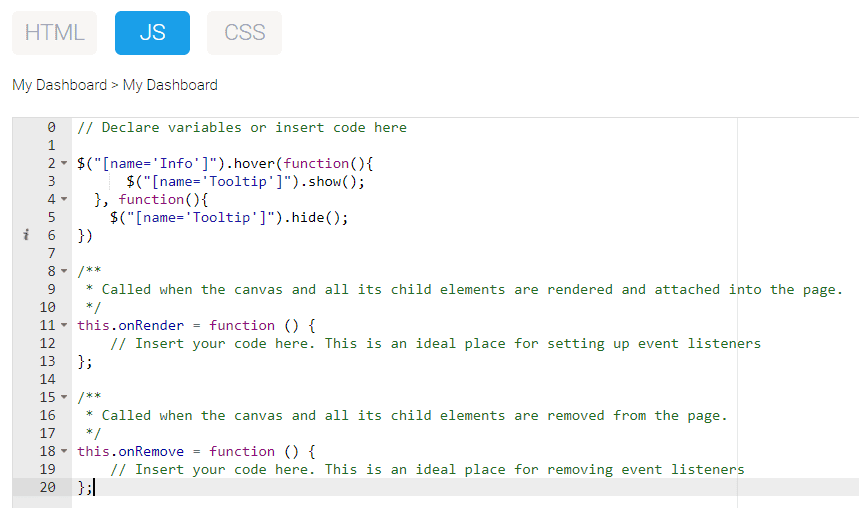
Select the JS (JavaScript) editor and enter the following code to show the Tooltip when a user moves the mouse over the Info icon and hide the Tooltip when a user moves the mouse away from the icon.
$("[name='Info']").hover(function(){ $("[name='Tooltip']").show(); }, function(){ $("[name='Tooltip']").hide(); })
Publish your dashboard and hover over the Info icon to show and hide your tooltip.