

Even though there are several ways of achieving this, in this article we will be focussing on Report Sections. Report Sections is one of the easiest ways to improve the readability of report, basically it means that you are splitting large tabular reports into smaller parts based on a category or dimension. Let’s look at an example:
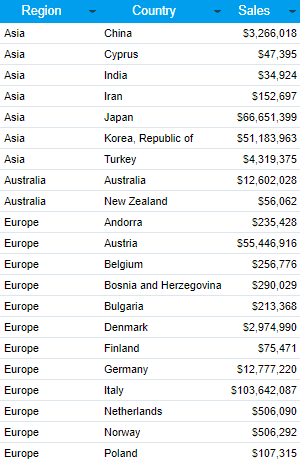
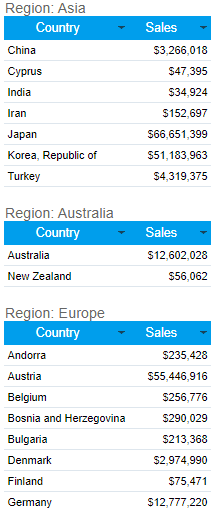
On the left, we have a tabular report showing the Sales by Region and Country. On the right, we have the same report but broken down into sections. In this case, the Region field was used to split the tabular report into smaller, more readable sections.
 |  |
The steps below will take you through the entire process step-by-step to create report sections.
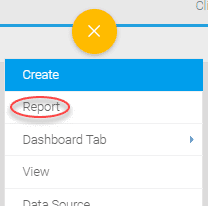
Create a new report based on the Ski Team view.
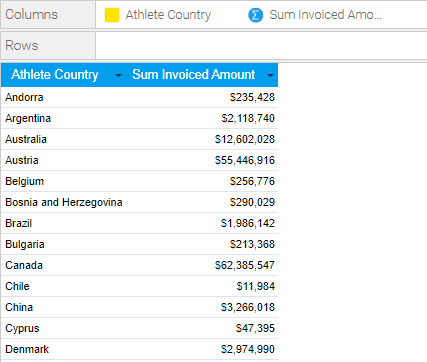
Add the Athlete Country and Invoiced Amount fields to the Columns Area.
The Invoiced Amount field has a Sum aggregation applied to it by default. This changes the results of the report by summing up all the invoiced records to give totals, rather than each unique invoiced record.
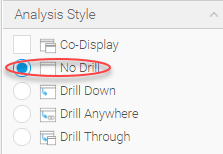
Disable the Drill Down.
You cannot add multiple fields from the same hierarchy to a report when drill down is enabled.
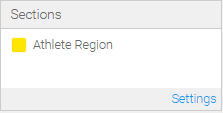
Add the Athlete Region field to the Sections area.
This will split the tables on the report into a section for each Region. In the data step of the report builder, you will only see the first section as this is only a preview of the report. For the final layout, you can go to the Design step.
You can add any number of fields to the section area but note that only dimensions can be added.
Proceed to the Design step of the builder.

You will now see that the table is split into smaller sections, one for each region.
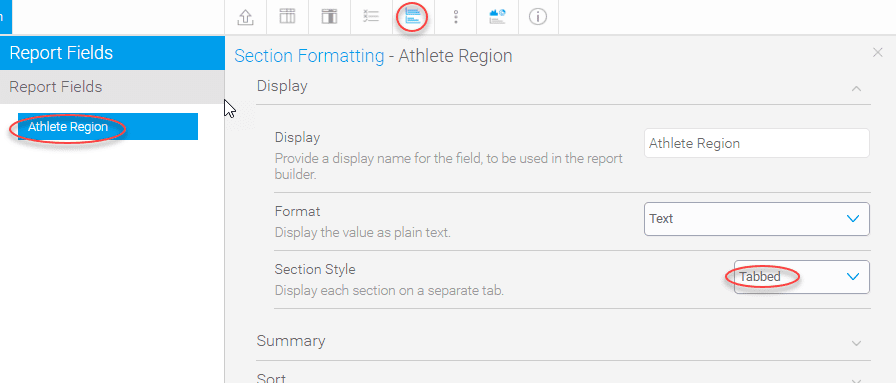
Click on the Section Formatting menu and select the Region field on the left. Change the Section Style option to be Tabbed.
The section formatting tab contains several menus that can be used to format the sections.
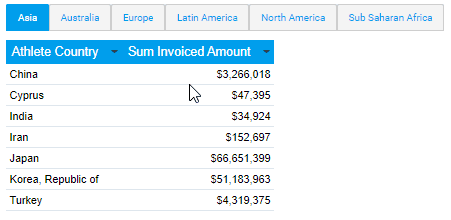
Close the menu. The sections will now be tabbed.
Publish the report.
If you add a chart to your report and then create sections within the report your chart will be sectioned as well. This means that for each section displayed a separate chart will be generated.