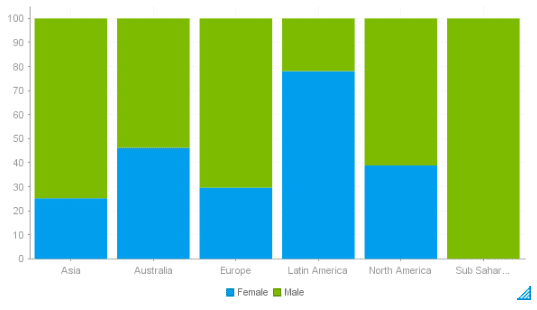
A good example when to use this chart is when you would like to show the percentage contributions for male and female sales by region.
I find 100% Stacked Column Charts most useful when you are comparing only two segments (e.g. male and female). Two segments are easier to read as each segment is aligned either to the top or the bottom of the chart.
Yellowfin does not have a built-in 100% column chart but it is possible to create these. Below are the steps that will guide you on how to create a 100% stacked column chart:
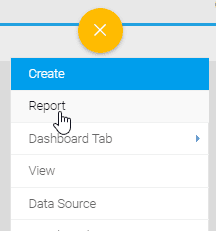
Create a new report based on the Ski Team view.
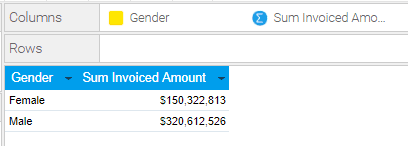
Add the Gender and Invoiced Amount fields to the Columns Area.
The Invoiced Amount field has a Sum aggregation applied to it by default. This changes the results of the report by summing up all the invoiced records to give totals, rather than each unique invoiced record.
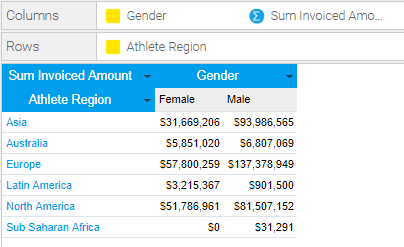
Add the Athlete Region field to the Rows Area.
This will create a cross-tab (pivot table) report.
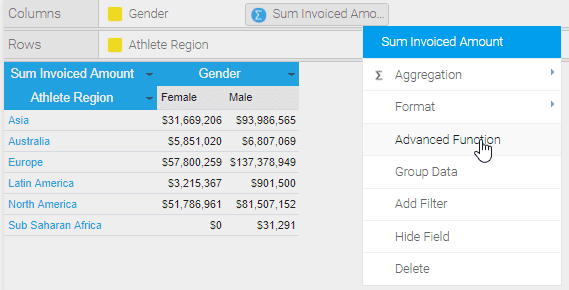
Open the Sum Invoiced Amount field’s drop down menu and select Advanced Function from the list.
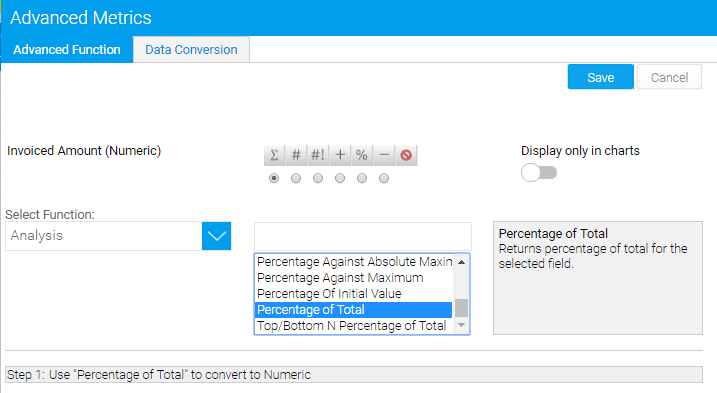
Select the “Percentage of Total” function from the list and click on Save.
This will change the Invoiced Amount value to the percentage contribution.
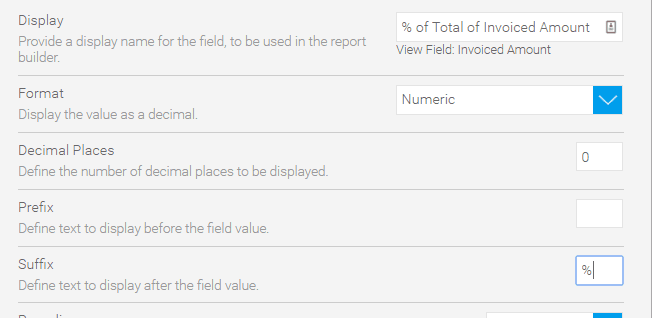
Format the % of Total Invoiced Amount field by removing the prefix and add a “%” sign for the suffix.
Proceed to the Charts step.
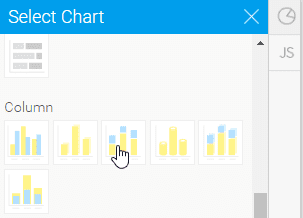
Select a Stacked Vertical Column chart from the Select Chart menu on the right.
Set the Horizontal Axis to Athlete Region, the Vertical Axis to % of Total Invoiced Amount and the Color to Gender.
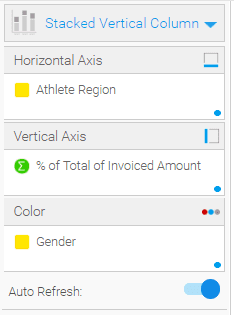
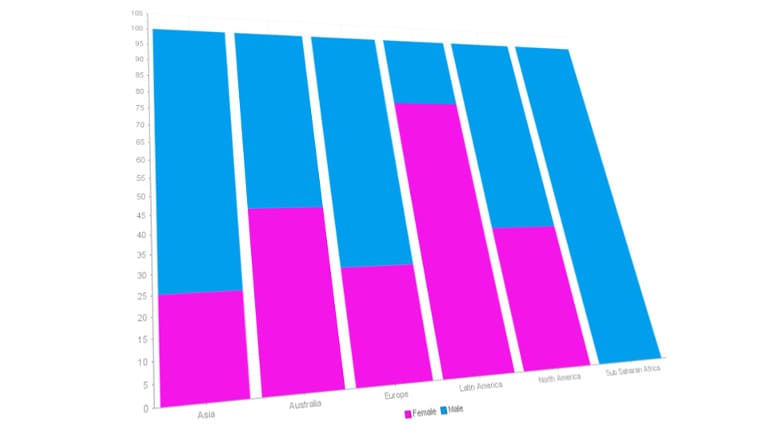
You will now have a 100% Stacked Column chart showing the percentage contribution by Gender for each Region.