

Although your charts or graphs might look great, you should ask yourself if it really presents the information in the best possible way that can be easily understood by the users. Is the way that you are presenting your data helping your users to find what they need to know in their data?
Charts should communicate the significance of your data in a clear and comprehensible manner so the audience can make sense of what’s going on and take action. Creating charts that does this will help your users making better decisions in a timely manner.
That might sound easier than it is as choosing the right chart can be a challenge. So how do you choose the right chart for your data?
For me, the most important step in chart selection is to ask yourself, “What is the purpose of this chart?”. Once you know the reason why the chart should exist, selecting the right chart will be much easier.
Yellowfin provided us with this flow diagram called the Chart Selector Guide to assist with chart selection. I really do like the way that this guide shows you the available Yellowfin chart types. It is easy to understand and helps users to choose the most appropriate chart. You can also find this Chart Selector Guide in Yellowfin’s WIKI pages.
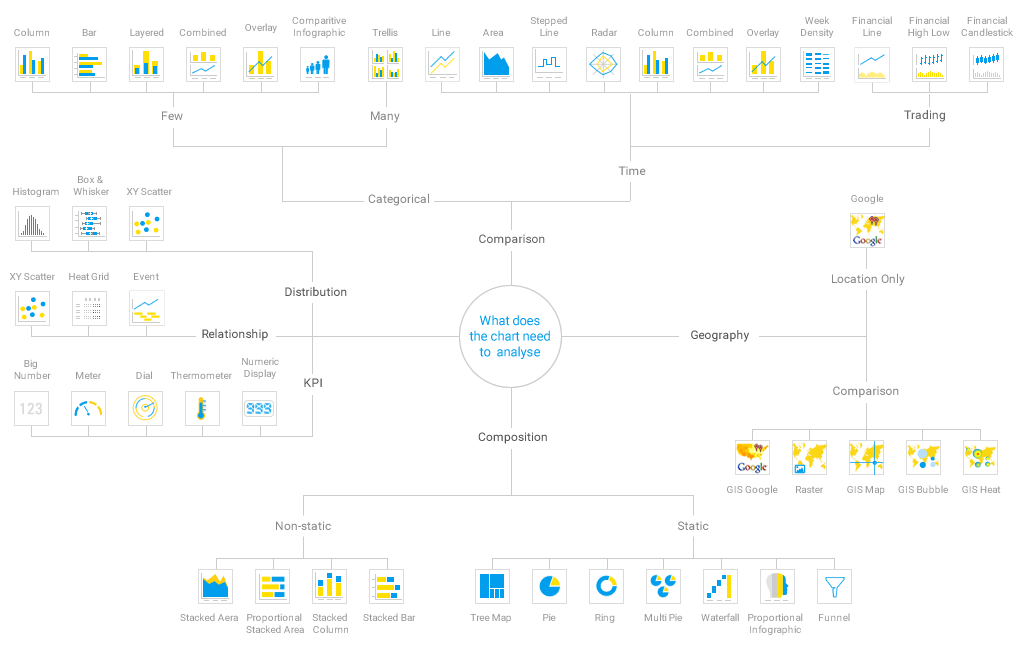
Using this diagram, you can decide which of these categories can help you present the right chart for your numbers. Then you will be able to provide your user with the easiest way to analyse their data and to share it with others.
If you would like to know more about the different categories, you can find explanations and more information on each of them here.
Hopefully, this will help you to choose the right chart for future BI projects. Unfortunately, when it comes to visualizing your data, there is no one size fits all approach. Most importantly, make sure that your audience understands the story you are trying to tell and can interpret the numbers.